
File:DJIA historical graph (log).svg

File original (File SVG, dimensiones nominal: 800 × 400 pixels, grandor del file: 880 KB)
.svg)
This file is translated using SVG <switch> elements. All translations are stored in the same file! Learn more.
For most Wikipedia projects, you can embed the file normally (without a To translate the text into your language, you can use the SVG Translate tool. Alternatively, you can download the file to your computer, add your translations using whatever software you're familiar with, and re-upload it with the same name. You will find help in Graphics Lab if you're not sure how to do this. |
.svg)
Summario
| Description |
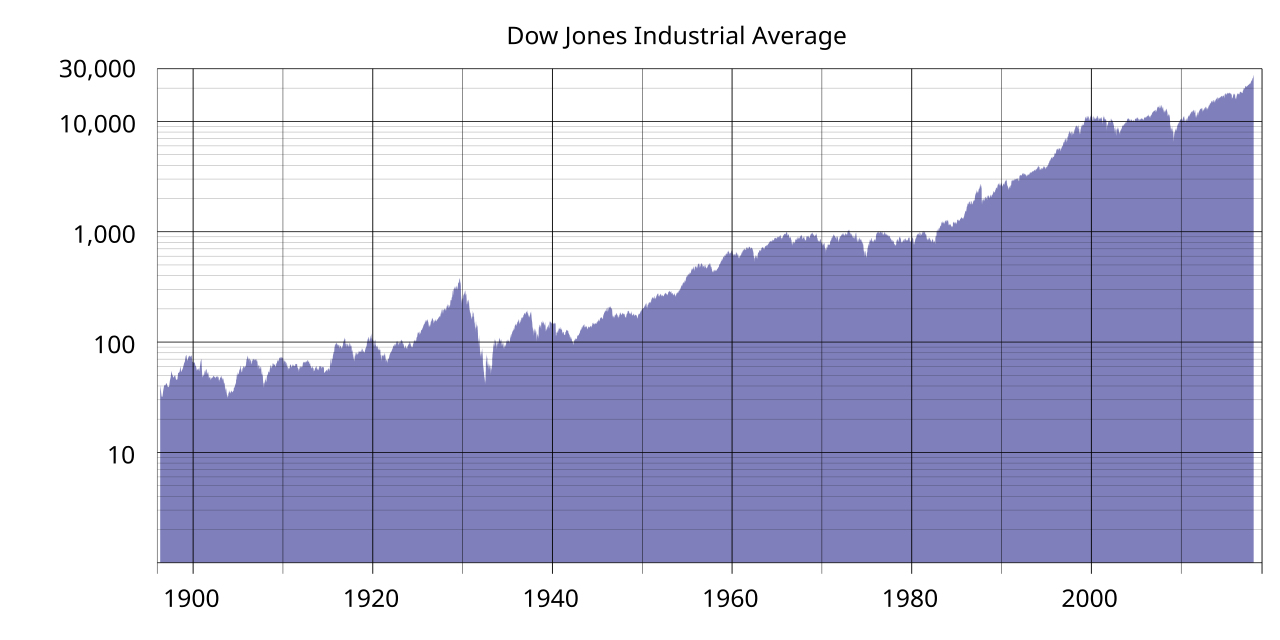
Same as en:Image:DJIA historical graph.svg, except logarithmic rather than linear. Log10 applied to all values. From May, 1896 - Dec, 1900: monthly closings; Source: [1] From Jan 4, 1901 - Dec 30, 2011: daily closings; Source: [2] From Jan 3, 2012 - present; Source: [3] See also: Linear version |
| Data | 6 de maio 2007 (original upload date) |
| Origine | Transferred from en.wikipedia to Commons. |
| Autor | Lalala666 at anglese Wikipedia |
| Altere versiones | Derivative works of this file: DJIA historical graph (log)-2008-29-10.svg |
-2008-29-10.svg)
Licentia
| Iste obra ha essite liberate al dominio public per su autor, Lalala666 at anglese Wikipedia. Isto vale in tote le mundo. In alcun paises isto pote non esser legalmente possibile. In tal caso: Lalala666 concede a omnes le derecto de usar iste obra pro non importa qual fin, sin conditiones, a minus que tal conditiones sia requirite per lege. |
Registro de incargamento original
- 2007-05-06 03:17 Lalala666 800×400×0 (670977 bytes) Less precision, maybe the SVG rasterizer will like this one better :/
- 2007-05-06 03:08 Lalala666 800×400×0 (800817 bytes) Same as [[:Image:DJIA historical graph.svg]], except logarithmic rather than linear. Log<sub>10</sub> applied to all values. Daily closings from Jan 4 1901 to Apr 27 2007.
Historia del file
Clicca sur un data/hora pro vider le file como appareva a ille tempore.
| Data/Hora | Miniatura | Dimensiones | Usator | Commento | |
|---|---|---|---|---|---|
| actual | 21:37, 28 januario 2018 | | 800 × 400 (880 KB) | Delphi234 | update |
| 04:09, 14 april 2016 |  | 800 × 400 (866 KB) | Delphi234 | update | |
| 23:55, 17 martio 2015 |  | 800 × 400 (858 KB) | Delphi234 | convert Unicode to UTF-8 | |
| 06:00, 5 martio 2015 |  | 800 × 400 (1,66 MB) | Delphi234 | add latin | |
| 03:04, 5 martio 2015 |  | 800 × 400 (1,66 MB) | Delphi234 | update | |
| 21:24, 1 novembre 2008 |  | 800 × 400 (791 KB) | Zeimusu | Adding a type="text/css" to keep validator happy | |
| 17:48, 4 april 2008 |  | 800 × 400 (791 KB) | Lalala666~commonswiki | Update | |
| 23:55, 20 octobre 2007 |  | 800 × 400 (655 KB) | Windupduck | {{Information |Description=Same as en::Image:DJIA historical graph.svg, except logarithmic rather than linear. Log<sub>10</sub> applied to all values. Daily closings from Jan 4 1901 to Apr 27 2007. '''See also: [[:en::Image:DJIA historical graph.s |
Uso de iste file
Il non ha paginas que usa iste file.
Uso global de iste file
Le altere wikis sequente usa iste imagine:
- Uso in bg.wikipedia.org
- Uso in bn.wikipedia.org
- Uso in de.wikipedia.org
- Uso in en.wikipedia.org
- Uso in fr.wikipedia.org
- Uso in hu.wikipedia.org
- Uso in hy.wikipedia.org
- Uso in id.wikipedia.org
- Uso in it.wikipedia.org
- Uso in ja.wikipedia.org
- Uso in ka.wikipedia.org
- Uso in ko.wikipedia.org
- Uso in krc.wikipedia.org
- Uso in la.wikipedia.org
- Uso in lt.wikipedia.org
- Uso in mn.wikipedia.org
- Uso in no.wikipedia.org
- Uso in ro.wikipedia.org
- Uso in sh.wikipedia.org
- Uso in sk.wikipedia.org
- Uso in sv.wikipedia.org
- Uso in th.wikipedia.org
- Uso in uk.wikipedia.org
.svg)